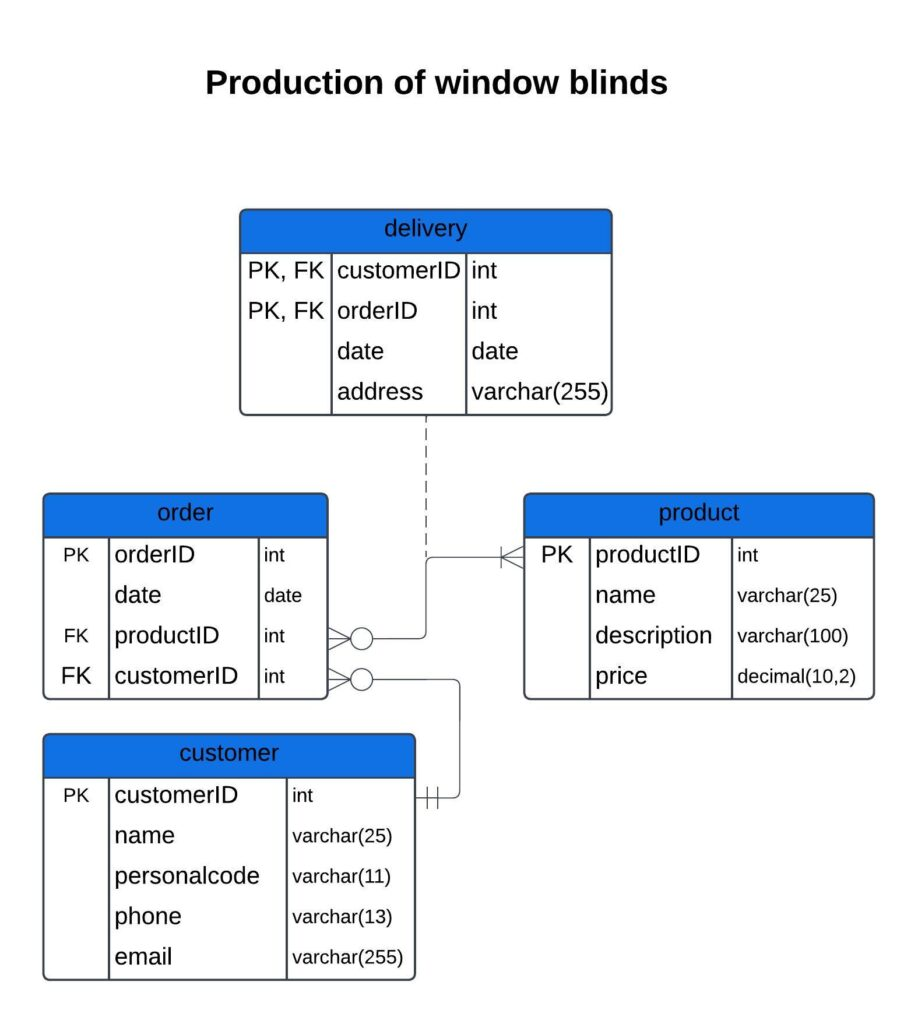
Database Diagram
A Database Diagram is a visual representation that shows how the tables in a database are related to each other. It helps to better understand the structure of the database and the relationships between different tables. For example, you can see which tables are connected and how data flows between them. It is a useful tool for planning and maintaining a database.
| Database Schema Designs | Andmebaasiskeemi kujundid | Элементы дизайна схемы базы данных |
|---|---|---|
| Table A rectangle representing a data table with rows and columns. |
Tabel Ristkülik, mis esindab andmetabelit koos ridade ja veergudega. |
Таблица Прямоугольник, представляющий таблицу данных с строками и столбцами. |
| Key Primary Key / Foreign Key |
Võti Esmane võti / Võõrvõti |
Ключ Первичный ключ / Внешний ключ |
| Field An element inside a table that holds a specific data type. |
Väli Tabeli sees olev element, mis hoiab konkreetset andmetüüpi. |
Поле Элемент внутри таблицы, который содержит определённый тип данных. |
| Relationship Shows how tables are connected to each other. |
Seos Näitab, kuidas tabelid on omavahel seotud. |
Связь Показывает, как таблицы связаны между собой. |
| Index Shows additional symbols pointing to tables for faster searching. |
Indeks Näidatakse täiendavate sümbolitega, mis osutavad tabelitele kiirema otsingu võimaldamiseks. |
Индекс Показывает дополнительные символы, указывающие на таблицы для ускорения поиска. |
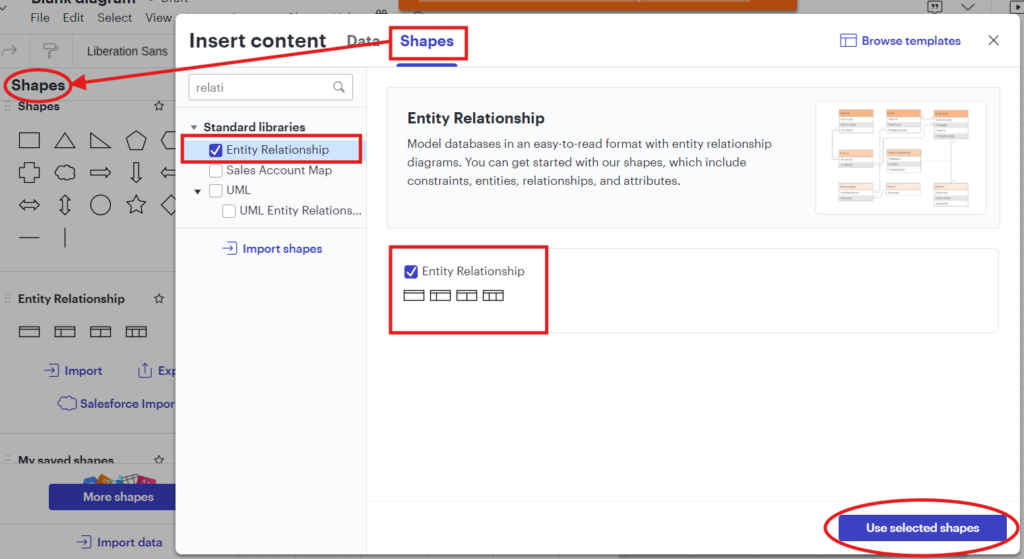
How to add shapes on the Licidchart website:
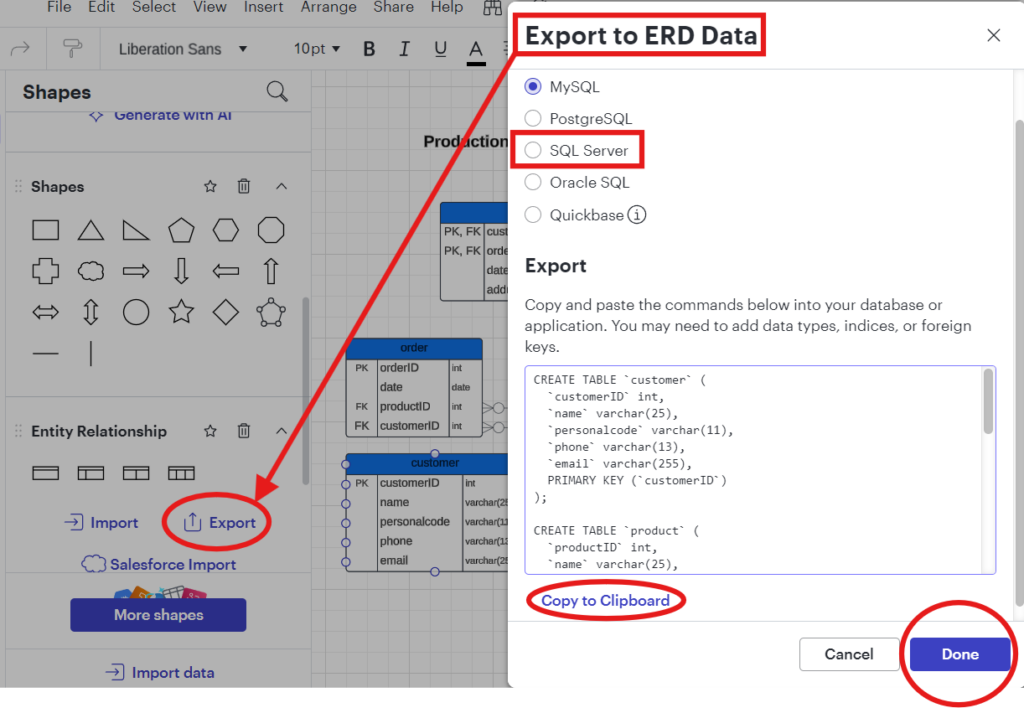
How to generate SQL code for creating a database using Lucidchart:
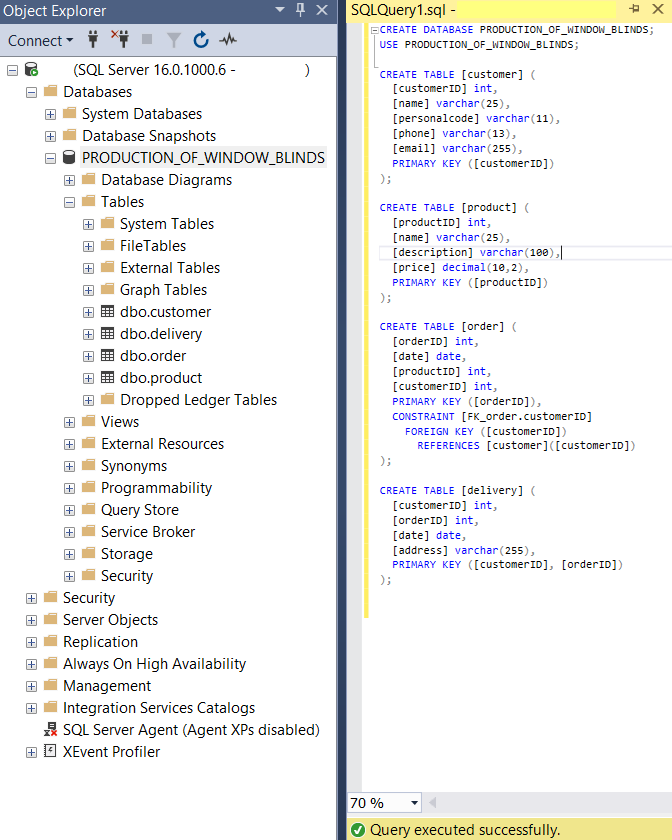
Create a database using Microsoft SQL Server Management Studio
| Vajuta | New Query |
|---|---|
| Sisestage | CREATE DATABASE PRODUCTION_OF_WINDOW_BLINDS; |
| Vajuta | Execute |
| Sisestage | USE PRODUCTION_OF_WINDOW_BLINDS; |
| Kopaeri | Lucidehart-iga genererritud kaod |
| Select | Kāik kaod peale “CREATE DATABASE PRODUCTION_OF_WINDOW_BLINDS;” |
| Vajuta | Execute |